Laypersons, technicians and the c-level will instantly understand and recognize where improvement is needed. Web Security Map creates fantastic maps that can be easily read and understood.
Using traffic light colors, it’s easy to see where action is needed.
Mapping key features:
Daily updates with new scan data: visualize change
Worldwide and up to date map data from Open Street Map
Support for polygons (eg: municipalities, provinces, regions) and points of interest (eg: offices, departments, locations)
Traffic-light coloring based on the highest risk issue
Search for regions, organizations, domains and sub-domains
Daily statistics for everything that is scanned, over time. Showing the decrease (or increase) of security issues. Statistics are available in various granularity and are enabled by default:
For each map
Best and worst scoring organization charts
Timeline: score per organization (see image)
Timeline: score per url
Timeline: division of issues
Donut chart + timeline: score per scan type
Timeline: amount of domains and services
Table: division of endpoints (ipv4/6, protocol, port)
The map is a high level view of security information. Behind every colored region or dot, a complete report is available, including second opinion tests and screenshots.
High level metrics are an instant call to action.
Each reports consists of three additional sections:
Measurements
Everything that has been measured is displayed per domain. Including a description and second opinion.
This allows technicians and operators to act and improve.
Risk Summary
A risk summary shows all risks from the report in a table.
Timeline
The timeline shows how risks have changed over time. It is split into high, medium and low risks, each with a separate mini-timeline.
Sometimes a security design requires disabling established practices. Even in these cases Web Security Map has got you covered.
With Comply or Explain, managers of an installation can create standardized and custom exceptions for findings: allowing something that would be incorrect by common assumption, to be correct and explained.
An explained issue shows up in reports as being explained, together with the original finding. Explained issues are removed from open issues, thus will show up in reports and statistics as a positive results.
Example scenario’s:
Certificate Revocation Lists are published on non-https domains
Some domains are used by devices only, which have an internal certificate authority which is trusted. (externally it shows as untrustworthy, as this is not a common certificate authority)
A test domain for incorrect configuration is needed for test purposes
Included is a script that automatically adds comply or explain for commonly used Microsoft domain services. This can be enabled and disabled.
Default scanning and classification is based on common web security standards pushed by OWASP, ENISA, Forum Standaardisatie and many other authoritative bodies.
WSM comes with a suite of management tools, including a management map, data edit interface and command line tools. This set allows you to be in control of everything that happens on a map.
Each of these tools comes with documentation in the form of instructions or a YouTube video.
Management Map
The management map allows for adding comply or explain information, as well as performing several management operations such as adding more domains to an organization.
It is a visual representation of the data in the system, akin to the website for visitors, but with more options.
Add domains using the management map
The admin site showing what data is processed and displayed.
Admin Site
The admin site allows editing and viewing all data. It makes changing settings and configuring your installation easy.
Dive further into the data from layers up to each scan. Perform actions like starting a scan.
Command Line Interface
Using the command line interface, it’s possible to start scans, add data and update map information.
The command line also is the way to update the installation with newer server configurations and software updates.
The command line allows experts to quickly verify and debug specific scan processed and results.
Logging in on a WSM server via SSH allows for usage of the server tool and websecmap command line utilities.
Web Security Map comes with great benefits for your organization.
Governmental benefits
Be in control of enormous amounts of data points
Web Security Map visualizes thousands of data points about security in an easily consumable way: using maps, timelines and reports.
Public accountability with Comply or Explain
Showing the state of basic security requirements for your country or sector creates public accountability and transparency. Even edge cases can be explained publicly using the comply or explain feature.
Software that scales
Web Security Map was written to work with thousands of domains and services in mind. Cognitively it also scales better then endless excel lists that just become hazy. Web Security Map helps you at scale.
Open Source, Open Data
Web Security Map is fully open source, aligning with many government practices. Open Source means that everyone can see how something works and improve it, which reduces vendor lock-in ($$$) and secrecy. Data gathered with Web Security Map comes from public data sources.
Professional Support
Professional support from the team that creates Web Security Map is available. They can help set it up, maintaining and implement wishes and requirements as needed.
Compliance Benefits
Track influence and impact
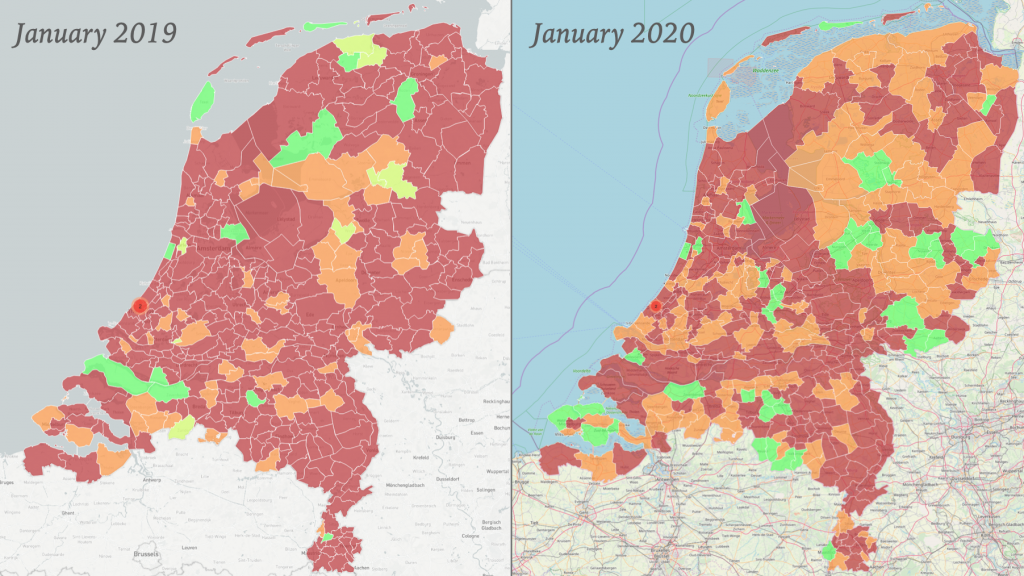
See how your improvement campaign influences the world: timelines show impact over time, and see how the map transforms from red to orange to green!
Automatic discovery of new domains and services
The IT landscape of your sector/branche/government is constantly changing. Web Security Map detects those changes and adjusts to this: adding new domains and services and deleting the ones that are removed.
Perform continuous audits
Web Security Map performs scans every day. This creates a live representation of your IT landscape. Instead of a single press release using a snapshot, be in charge with continuous updates without lifting a finger.
Public Benefits
Publish data that everyone understands
With Web Security Map, data is visualized in a way that allows a wide audience to understand the current security situation. It helps everyone understand how well you are doing, and where action is needed.
Drive the change with tangible actions
Details in Web Security Map are clear and tangible. Reports show individual metrics, including an option for a second opinion and documentation. Engineers can take these up and perform improvements.
Public Relation opportunities
Show where you are, by using data from Web Security Map: maps, timelines, charts and reports. Open up communication about security in a clear and meaningful way.
Transparency increases trust
Being transparent about security shows that you are in control. Show that you actively measure, report, respond and improve. This creates trust about the capabilities of your organizations.
Technician benefits
The outside perimeter at a glance
Retrieve information about the entire outward facing perimeter at a glance: not leaving behind or skipping any domain or service.
High Quality Datasets
Create high quality datasets based on the information published on your Web Security Map installation.
Second opinions and documentation
Each discovered metric in Web Security Map comes with links to second opinion scans and documentation. This helps with understanding the issue quicker, making it easy to improve.
The Netherlands was the first country to meet Web Security Map. This was part of the SIDN Fonds supported project “Failmap”. The implementation caused massive changes in security at Dutch Municipalities.
Monitor and visualize security risks for an entire country, industry or sector. This is what Web Security Map does best.
Taken from our Demo environment in the Netherlands, we monitor all Dutch municipalities, provinces and governmental organizations. To give an impression:
Layer
Organizations
Domains
Services
Municipalities
357
8.730
13.659
Provinces
12
654
1114
Government
885
23.340
17.598
TOTAL
1254
32.724
32.371
Size of monitor of the Dutch Government. Data from basisbeveiliging.nl june 2020.
The installation of Web Security Map had great impact. Here is an overview of improvements made by Dutch Municipalities in 2019: about 1000 high risk issues (mainly missing or weak encryption) are fixed.
Web Security Map monitors a range of modern security standards. They are required for operating an internet service securely. Many of these are mandated by governments and standard bodies worldwide.
For example: when visiting a website, a secure (HTTPS) connection is needed to ensure integrity and privacy.
Web Security Map is intended for public installation and visibility: allowing everyone in the world to see results. This creates accountability. Because of the public nature of Web Security Map, there are limitations in its capabilities.
Transparency comes with responsibility: Web Security Map only explicitly scans and published information that does not increase risk. The data published with Web Security Map gives a first impression about risk monitoring, handling and mitigation of an organization.
Scanned and published
Security Standard
Technology
Max. Severity
DNSSEC
DNS
High
TLS Encryption Quality
HTTP / TLS
High
Trust in TLS Certificate
HTTP / TLS
High
Websites without TLS
HTTP / TLS
High
Unencrypted File Transfer
FTP / auth
High
Encrypted Mail Transport
Mail / TLS
High
SPF Record
Mail / DNS
Medium
DKIM Record
Mail / DNS
Medium
DMARC Record
Mail / DNS
Medium
Strict Transport Security
HTTP
Medium
X-Frame-Options
HTTP
Medium
X-Content-Type-Options
HTTP
Low
X-XSS-Protection
HTTP
Low
Table of issues scanned for with Web Security Map
Out of scope
Transparency comes with responsibility. This means the following risks will not be scanned and publicly reported. These types are handled in Responsible Disclosure vulnerability programs.
Web Security Map does not scan or report on critical security risks such as:
SQL injection, Path Traversal, Vulnerable Versions (banner grabbing), Buffer Overflows, Weak passwords, Open Directories, Severe Misconfigurations, Missing Authentication, Permission Issues, Insecure Uploads and many others.
WSM supports importing data from Open Street Maps and Wikidata, as well as uploading Spreadsheets with address information. Your imagination is the limit in selecting your target audience.
Open Street Map
Open Street Map contains tons of information about regions, provinces, municipalities, cities and countries.
WSM supports importing these layers and creating (and updating) a map based on these.
Wikidata
Using Wikidata, data from Open Street Maps in automatically enriched. Wikidata is a public repository of information about the world. This includes information about regional data.
Wikidata is automatically consulted when importing data from Open Street Map
Excel / Spreadsheets
It’s also possible to upload spreadsheets with location data. These locations are converted to points of interest.
Location data is geocoded with the Google Geocoding API, which requires a free Google Developer account. Instructions on obtaining these are included in WSM.
Web Security Map comes with online documentation, installation instructions and a series of YouTube videos. While we improve installation and operating practices all the time, these videos can come in handy to get a general sense of what Web Security Map does in practice.
These videos help with setting up an installation for the first time. This is an overview of those videos:
Installation
This video shows how to install Web Security Map on a virtual machine. This is done with a single command on a clean and dedicated machine.
Video showing the installation and maintenance process of Web Security Map
Import Countries
This video shows how to import countries to the map. It shows how to create an administrative region (if it doesn’t exist yet) and import data from Open Street Maps. It will then guide how to display the new country to your visitors and how to allow scans to happen. Once you get the gist of it, you’ll be able to add another country in seconds.
Video showing how to import countries and regions into Web Security Map
Admin Interface
This is a tour of the Web Security Map admin interface. It shows how this interface works in general and what data is stored. This can help you administer the data in Web Security Map and get a deeper understanding of its inner workings. With the knowledge presented in this video you can explore all data in Web Security Map yourself.
Video exploring the admin interface of Web Security Map
Configuration
Configuration options allow you to display all kinds of interesting stuff on the website, as well as use external services to improve the Web Security Map experience, and to enable or disable scanners. The video is extensive and show exactly how each setting affects the working of your Web Security Map installation.
Video showing configuration options for Web Security Map
Excel uploads
This video shows how to add large numbers of organizations to the map. This is done by uploading a spreadsheet. The spreadsheet is downloaded and edited. When uploaded the organizations are added to the database. A report is created and a new layer is configured to show the new organizations on the map.
00:23 Demo of 1000+ organizations (entire Dutch government)
Web Security Map is an open source project. It is available on GitLab.
WSM costs you nothing to download, run or modify: except for your time, patience and skill. Instructions are published on gitlab and youtube. (todo: link)
Our efforts are backed by income from:
Yearly Community Subscriptions
Time and skill donated by volunteers
Implement new features on request
Providing commercial services by our team
hosting
feature implementation
support
trainings
Buying one of our services This helps us cover costs for continuous development and improvements. Visit our shop, here. Or contact us, here. (todo: links)
Organizations that run Web Security Map, we highly encourage to purchase a yearly Community Subscription. This allows us our organization to continue development.
Buying one of our services allows continuous improvement of Web Security Map. In case you don’t need any of our services, we recommend a yearly Community Subscription. You can get that in our shop, here. (todo: create shop).
Web Security Map is supported by experienced software developers. They can assist you in deploying, maintaining, hosting and developing your Web Security Map installation.